Walkthrough · Off northern California, 2022–2023
What had already been seen at this dive site?
Before sending a robot back to the deep seafloor, we asked what other robots had already seen there. A sailing drone had passed 8 km away. Here's how we found it, read its raw sonar, and what it showed.
The question
Before going back down
In April 2023, NOAA's ship Okeanos Explorer sent its robot Deep Discoverer down to the seafloor off northern California, 971 metres deep. If you were planning to go back, the first question is simple: what has already been seen at this spot?
The answer turned out to be spread across four NOAA systems. Eight months before the dive, a NOAA sailing drone with a fish-finding sonar had passed just 8 km away. Its sonar recordings sit in NOAA's public cloud storage, its route sits on a NOAA lab's server in Seattle, the dive sits with NOAA Ocean Exploration, and 75 years of ocean measurements sit at NOAA's data center.
This post walks through finding all of it in one place with AQUAVIEW, then reading it in a notebook and asking Claude about it. Every link, prompt and script is here so you can run it yourself.
Step 1
Start with the robots
In Explore, open Sources and tick Uncrewed systems (UxS). That one tick selects every robot source we have: sailing drones, underwater gliders and deep-sea robots. Under Data type, keep Trajectory (robots that move) and Video.
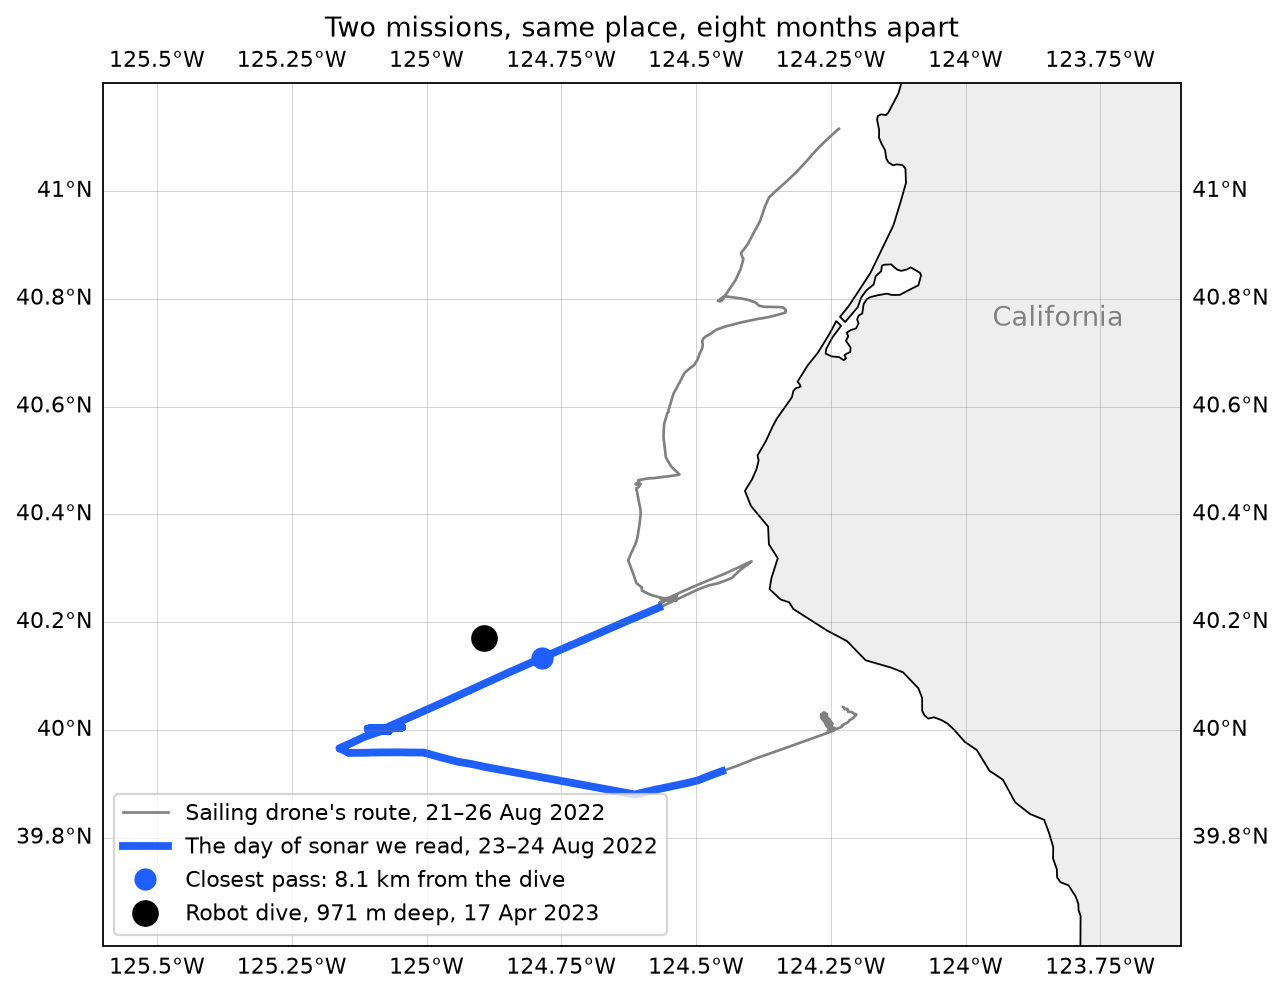
Along this stretch of coast that leaves 16 datasets. Two of them are sailing-drone sonar surveys from summer 2022. Others are Okeanos Explorer's 2023 dives, with their videos. Two NOAA programmes, a year apart, found in one search, without knowing either existed.
Open the mapStep 2
Zoom into one dataset
Open the drone's sonar. AI Insight explains in plain words what it is. The description gives the size: 1,944 files, 323 GB, recorded at two sound frequencies from June to September 2022 on a NOAA fisheries survey.
AQUAVIEW doesn't copy any of it. The dataset points to where the files already live, in NOAA's public cloud storage, with a citation ready to use.
Open the drone's sonarStep 3
One click to a notebook
Add three datasets to your cart:
- the drone's sonar, SD1076-2022-06_EK80
- the drone's route, sd1076_swfsc_2022
- the dive, EX2301_DIVE02
Then click Generate notebook and Open in Colab. You need to be signed in to generate one. The notebook uses the AQUAVIEW Python package (pip install aquaview) to look up all three datasets, so every file link and position is already there. Nothing is typed in by hand.
From the drone's route and the dive's position, the notebook finds the closest pass: 8.1 km, on 23 August 2022. The dive came almost eight months later.
Step 4
A day of sonar, read where it lives
Reading 323 GB isn't practical, and you don't need to. The notebook reads a few small slices of each hourly file straight from NOAA's storage, about 23 MB of every 230 MB, and builds one full day around the closest pass.
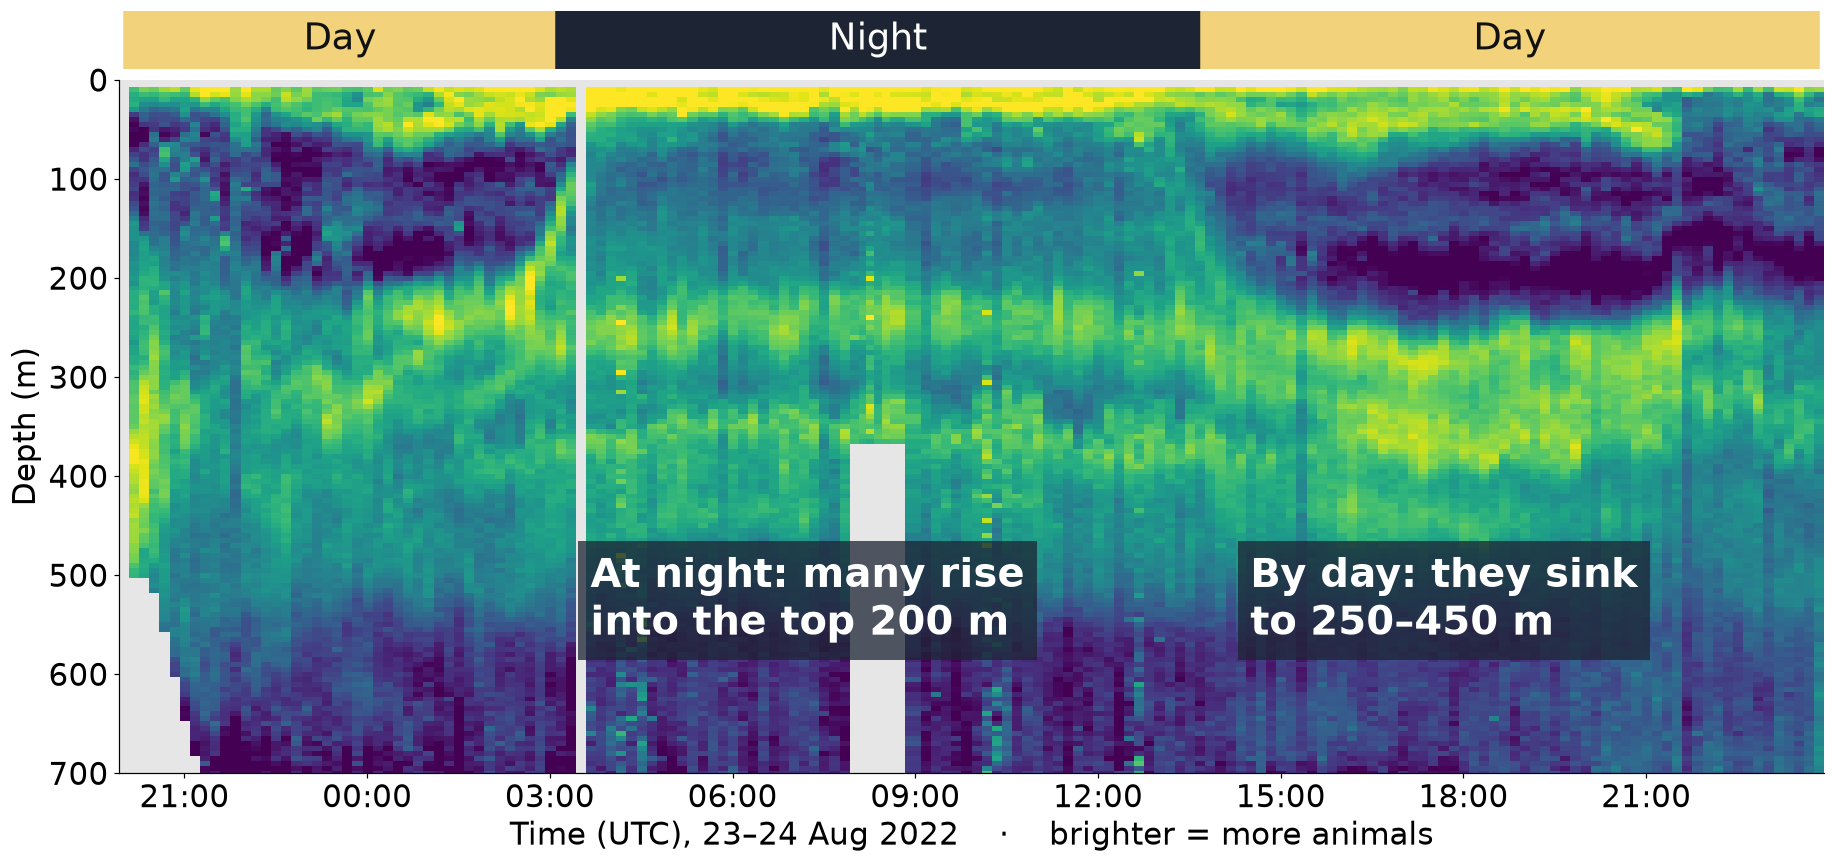
The bright band is huge numbers of small animals. By day they sink to 250–450 m, where it's dark. At night many of them rise into the top 200 m to feed, and at sunrise they go back down. It's often called the largest migration on Earth, and it happens every day, right next to the dive site.
Step 5
75 years of measurements, one Python package
What's the water like where those animals spend the day? NOAA's World Ocean Database holds every temperature, salt and oxygen measurement taken in the area since 1950. AQUAVIEW serves it through the same Python package:
client = aquaview.Client()
raw = client.get_data("wod", VARS, bbox=BOX, datetime="1987-01-01/1987-12-31T23:59:59Z")
Within 25 km of the dive, that's 2,110 measurement trips and 194,487 readings, from 1950 to 2023. The history has a surprise in it.
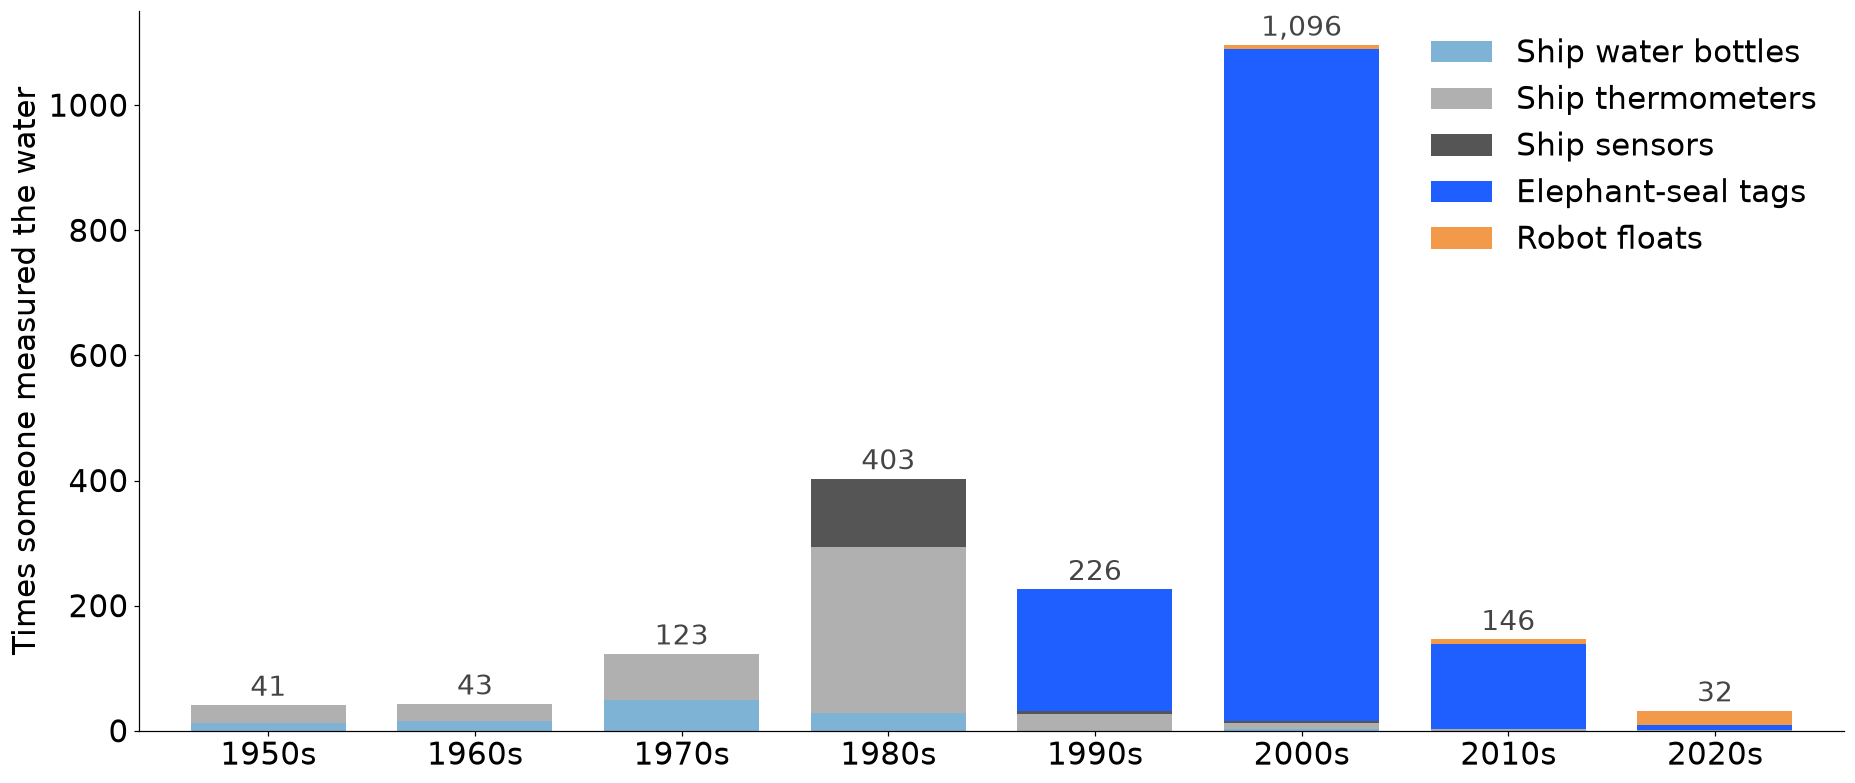
Almost every trip measured temperature. Only 81, about 1 in 25, measured oxygen, mostly ship water bottles from the 1950s to the 1980s.
Step 6
The water by day and by night
Put the two together. Take the depths the sonar showed, and look up what the water is typically like there.
Micromoles per kilogram, in water at 6.3 °C. Typical across 70 trips that measured oxygen at these depths.
Micromoles per kilogram, in water at 9.3 °C. Typical across 81 trips that measured oxygen.
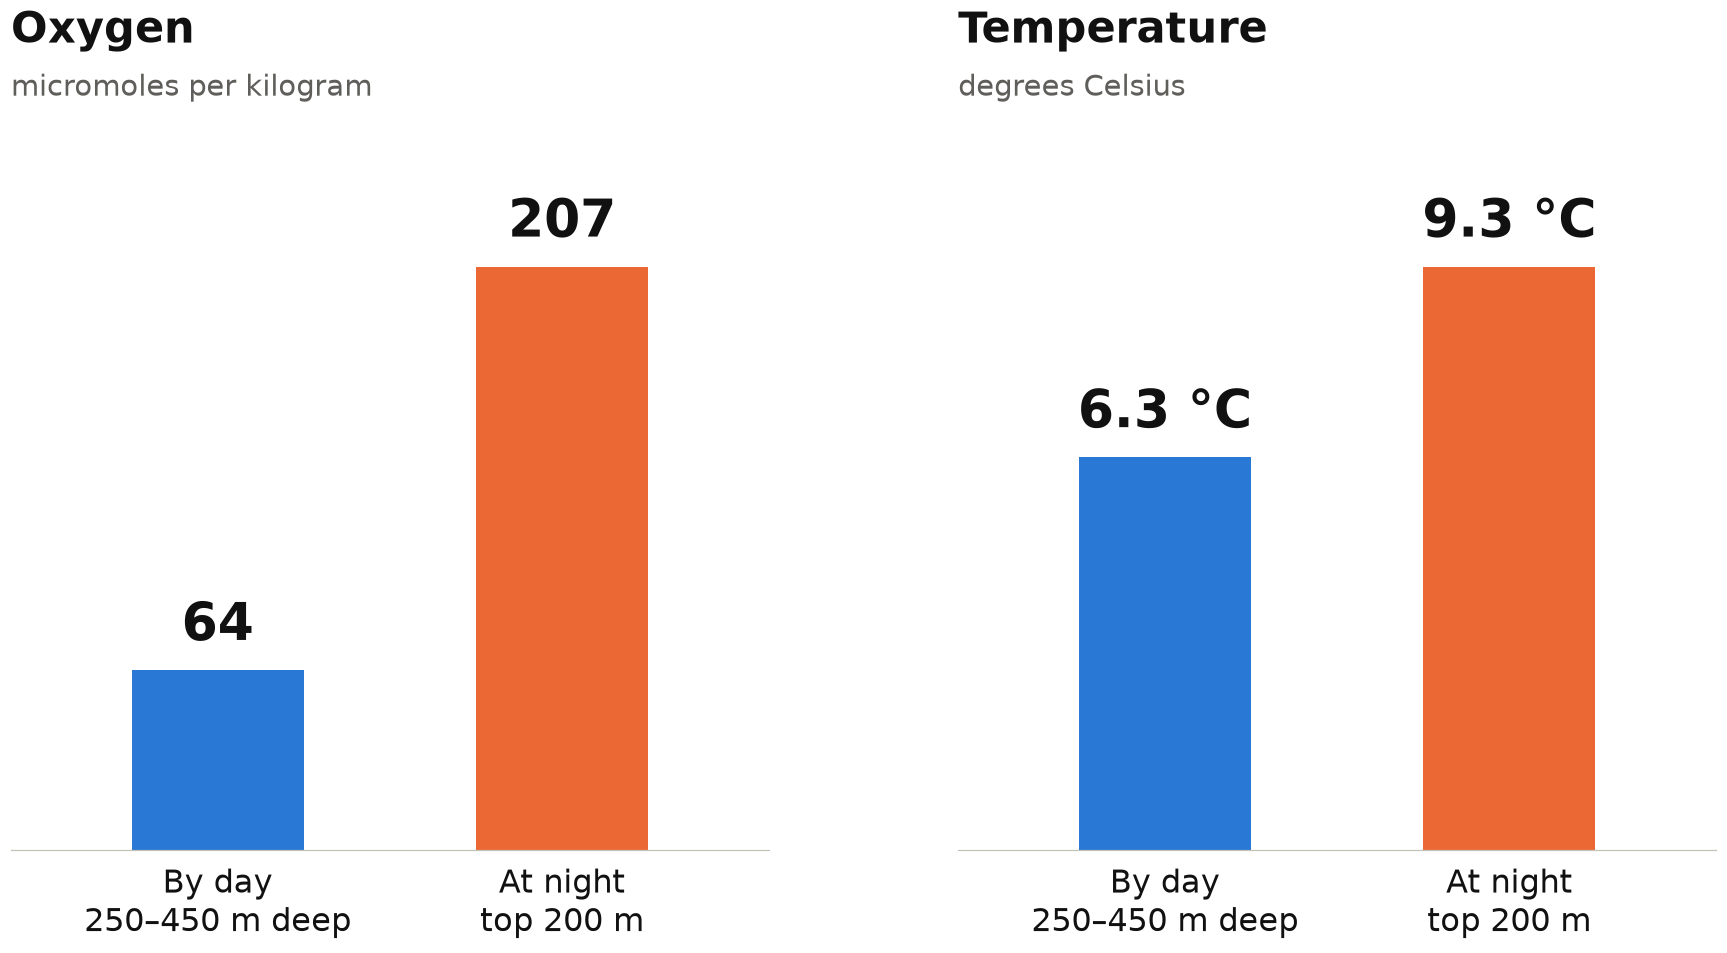
By day, the animals sit in water with about a third of the oxygen, and 3 °C colder, than where they feed at night. Most likely, they're staying out of reach of predators that need more oxygen.
Step 7
Or just ask Claude
Not everyone on a team writes code. AQUAVIEW also runs an MCP server, so AI assistants like Claude can search and read the catalog directly. In Claude Desktop, open Settings, then Connectors, then “Add custom connector”, and paste this address. Custom connectors need a Pro, Max, Team or Enterprise plan.
https://mcp.aquaview.org/mcpThen ask:
Using AQUAVIEW, look up two records: the Saildrone sonar record SD1076-2022-06_EK80 (collection WCSD) and the ROV dive EX2301_DIVE02 (collection OE_ROV). Summarise each in two or three plain sentences for someone planning a dive: what it is, who collected it, when, what it measured, and where the data is stored. Then tell me how many months apart they were.
Claude looks up both datasets and explains them in plain words:
- The drone's sonar is NOAA's Southwest Fisheries Science Center, June to September 2022, with 1,944 files in NOAA's public cloud storage.
- The dive is NOAA Ocean Exploration's Deep Discoverer, 17 April 2023, down to 971 m, measuring temperature, salt and oxygen, with 5 water samples.
Try it yourself
Run it yourself
The whole analysis: fill the cart above and click Generate notebook, or open the full notebook in Colab and use File → Save a copy in Drive to run your own copy.
Open the notebook in ColabJust the day-and-night water, in one short script. It takes about 12 minutes, because it asks for one year at a time.
1Save this as divesite.py.
import io, time, aquaview, pandas as pd

client = aquaview.Client()                         # no key needed for public NOAA data
BOX = [-125.187, 39.946, -124.598, 40.396]         # 50 x 50 km around the dive: west, south, east, north
VARS = ["time", "latitude", "longitude", "depth", "temperature", "salinity", "oxygen", "dataset"]

def year(y):
    """75 years at once is too slow for one request, so ask a year at a time."""
    for attempt in range(3):
        try:
            raw = client.get_data("wod", VARS, bbox=BOX, datetime=f"{y}-01-01/{y}-12-31T23:59:59Z")
            return pd.read_parquet(io.BytesIO(raw)) if raw else None   # empty years come back empty
        except aquaview.AquaviewAPIError:
            time.sleep(20)
    raise RuntimeError(y)

df = pd.concat([d for y in range(1950, 2027) if (d := year(y)) is not None], ignore_index=True)
df[["depth", "temperature", "oxygen"]] = df[["depth", "temperature", "oxygen"]].astype(float)
df["trip"] = df.groupby(["time", "latitude", "longitude"]).ngroup()
print(f"{df.trip.nunique():,} measurement trips, {len(df):,} readings")

def typical(var, top, bottom):
    band = df[(df.depth >= top) & (df.depth < bottom)].dropna(subset=[var])
    return band.groupby("trip")[var].mean().median()

for name, (top, bottom) in {"by day, 250-450 m": (250, 450), "at night, top 200 m": (0, 200)}.items():
    print(f"{name}: oxygen {typical('oxygen', top, bottom):.0f} umol/kg, "
f"temperature {typical('temperature', top, bottom):.1f} C")2In a terminal, in the same folder, run these four lines. You need Python 3.10 or newer.
python3 -m venv divesite
. divesite/bin/activate
pip install aquaview pandas pyarrow
python divesite.py3You should see:
2,110 measurement trips, 194,487 readings
by day, 250-450 m: oxygen 64 umol/kg, temperature 6.3 C
at night, top 200 m: oxygen 207 umol/kg, temperature 9.3 C
The honest part
How far to trust it
Were the drone and the robot there at the same time?+
No: August 2022 and April 2023. For planning a dive, “same place, different year” is exactly what you want, but it isn't a side-by-side comparison.
Is the oxygen from the day the drone passed?+
No. It's the typical water across 81 measurement trips between 1950 and 2021, none from August 2022.
Can the sonar tell which animals they are?+
No. It shows how many animals there are and where, not which species. That would need a net.
Why a 50 km box?+
It's a choice. A 25 km box has only 35 trips that measured oxygen, too few to trust. A 100 km box has more data but reaches further from the site.
What's next
Bring your own robots
Right now, these are NOAA's robots. Next, partners will be able to register their own buckets and servers, so their drones and gliders show up in this same search, right next to NOAA's.